Devtools
@beignet/devtools gives local apps a live timeline for Beignet activity: requests, errors, use cases, domain events, jobs, outbox delivery, schedules, payments, feature flags, entitlements, policies, and provider activity.
bun add @beignet/devtoolsSetup
1. Register the provider
import { createDevtoolsProvider } from "@beignet/devtools";
import { createNextServer, createNextServerLoader } from "@beignet/next";

export const getServer = createNextServerLoader(() =>
  createNextServer({
    ports,
    providers: [createDevtoolsProvider(), ...otherProviders],
    context: async ({ ports, requestId, trace }) => ({
      requestId,
      ...trace,
      ports,
    }),
  }),
);
The provider is the only wiring devtools needs. The server itself owns request
instrumentation: createServer(...) resolves a request ID and W3C trace
context for every request, writes the x-request-id and traceparent
response headers, and records request and error events into the resolved
provider instrumentation port. Requests under /api/devtools are ignored by
default so dashboard traffic does not pollute the timeline. See
request lifecycle for the instrumentation option that
configures headers, ignored paths, redaction, and capture decisions.
Devtools does not require the OpenTelemetry SDK, but events are shaped for
OTel-compatible correlation with traceId, spanId, parentSpanId, and
traceparent from @beignet/core/tracing. Install the
OpenTelemetry provider when the app should export active
spans and production metrics while retaining this local timeline. Spread the
trace context argument into your app context so deeper instrumentation stays
on the same trace.
2. Add the dashboard route
// app/api/devtools/[[...path]]/route.ts
import { createDevtoolsRoute } from "@beignet/devtools";
import { getServer } from "@/server";

export const { GET, POST } = createDevtoolsRoute(
  async () => (await getServer()).ports.devtools,
  {
    basePath: "/api/devtools",
  },
);
Visit /api/devtools in development.
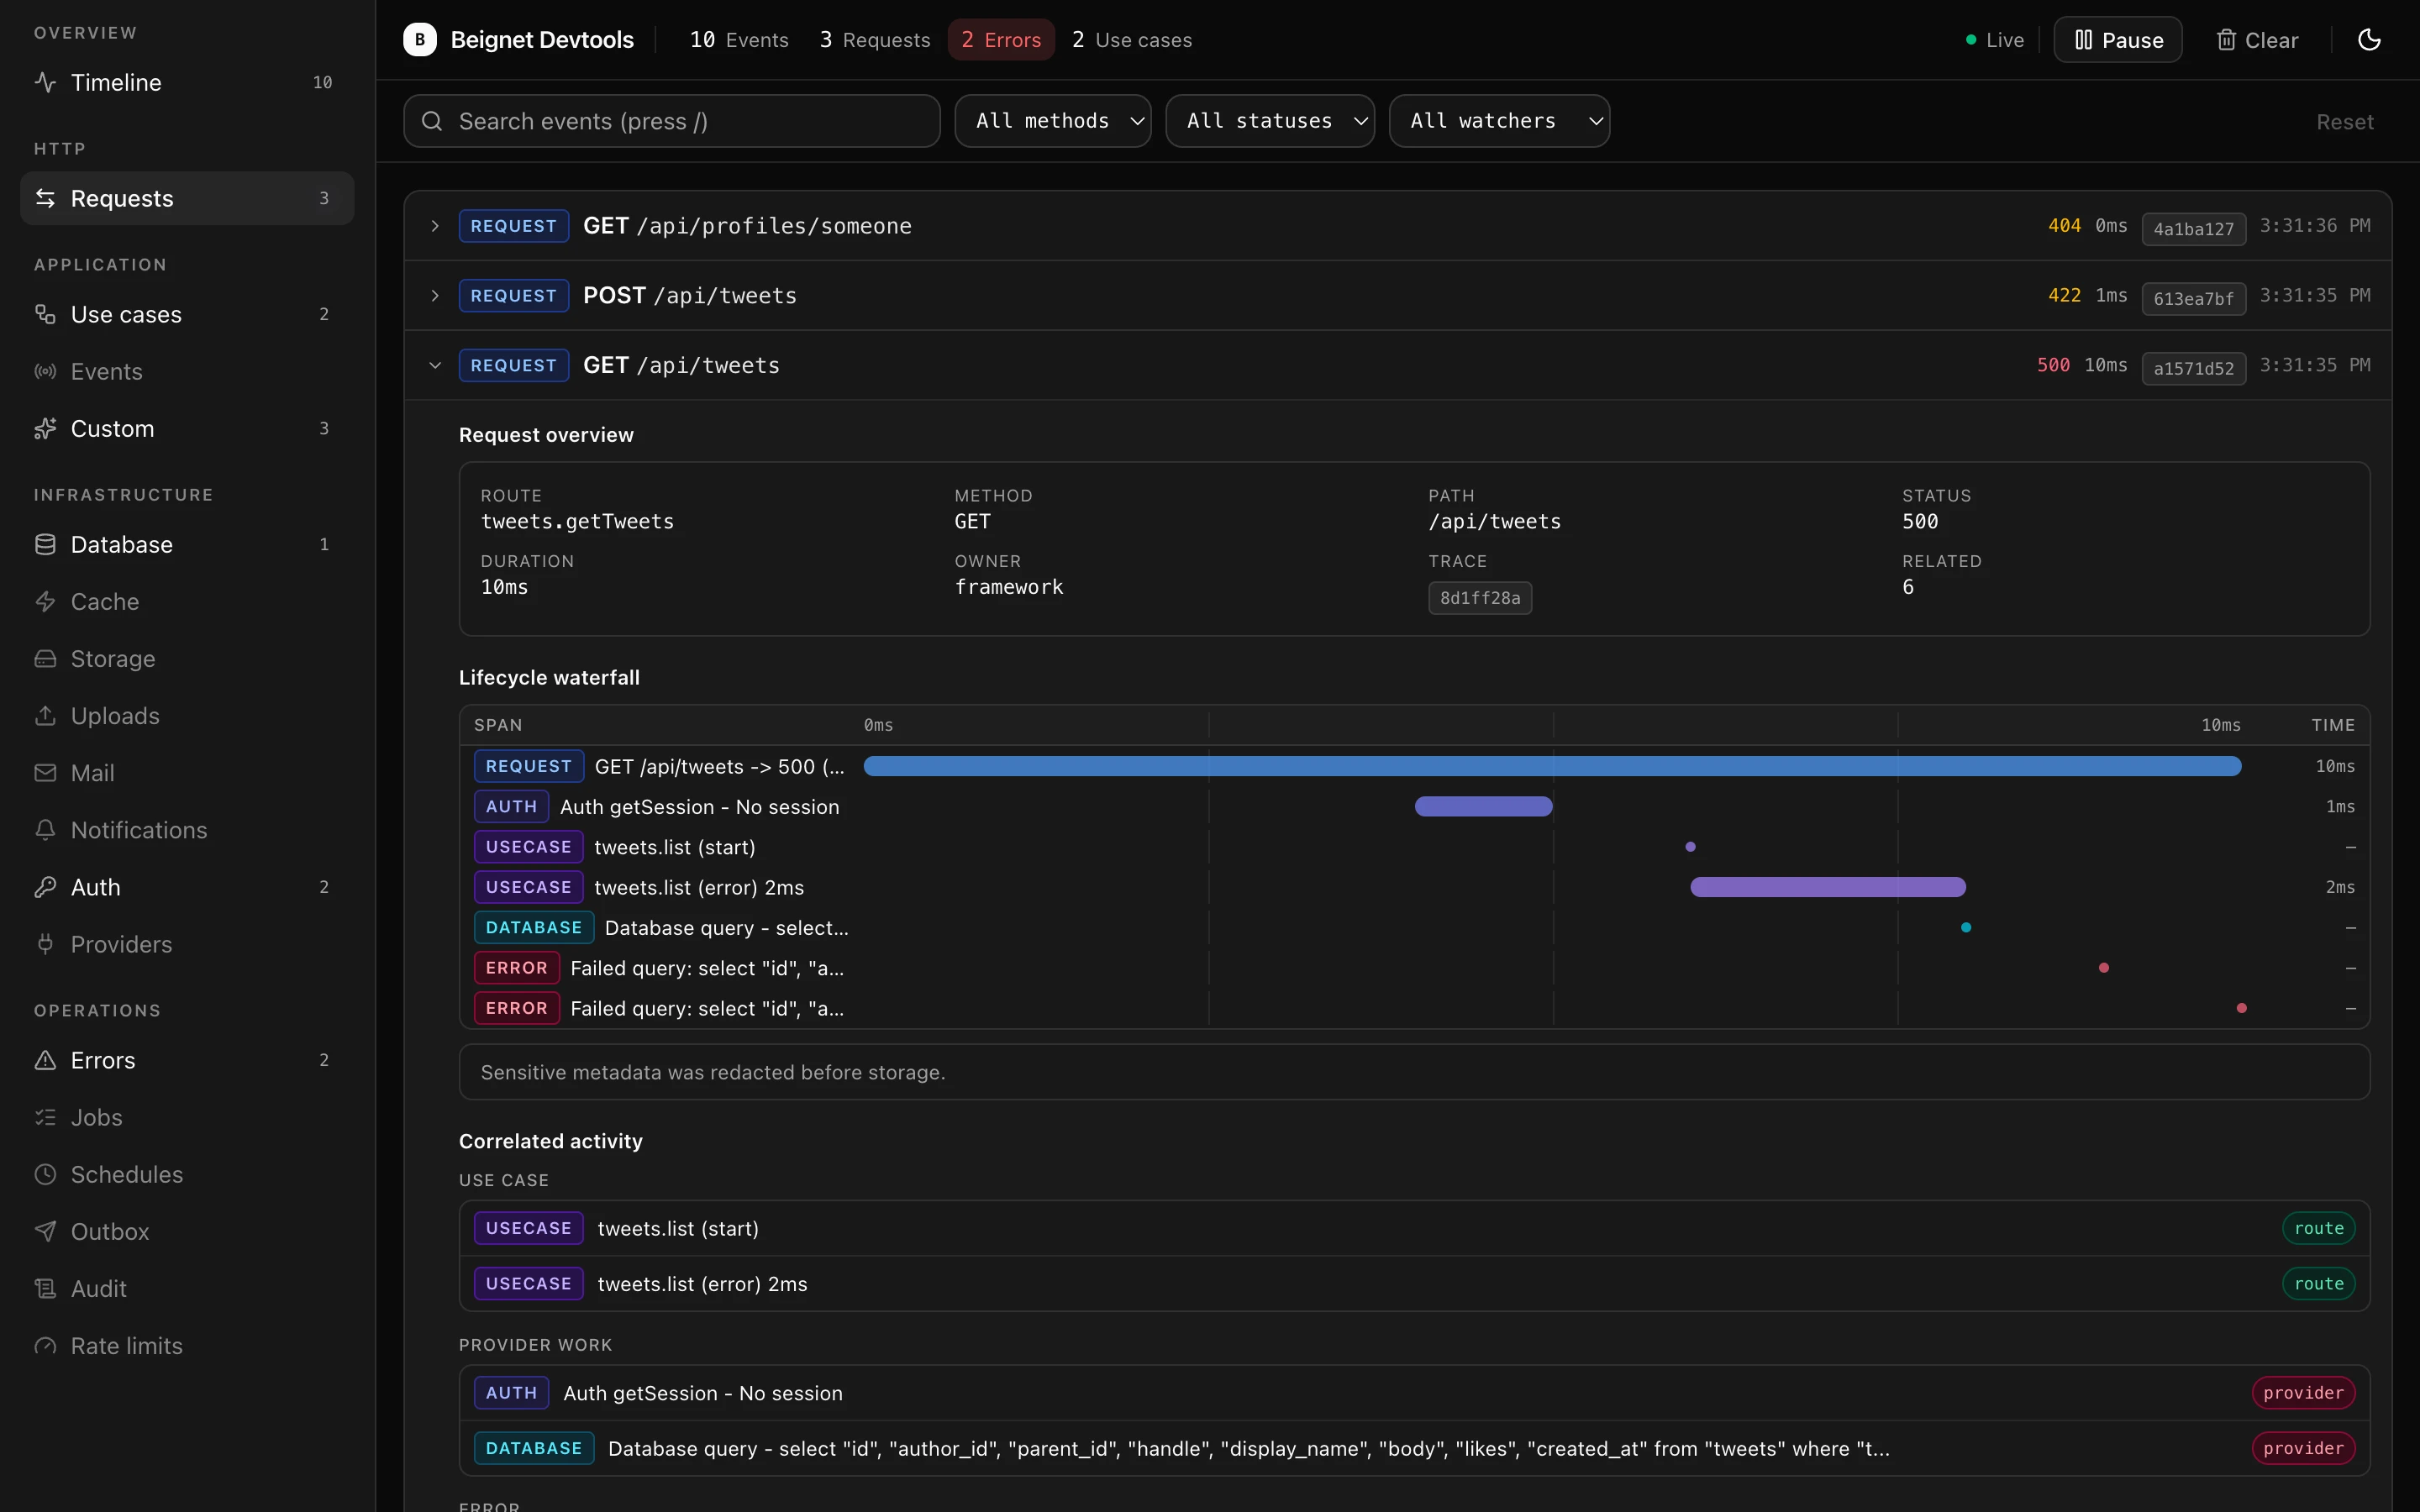
The dashboard streams live events over Server-Sent Events, groups views by
section in the sidebar, and supports search (/), method/status/watcher
filters, Pause/Resume, and Clear. Request rows expand into an end-to-end
lifecycle view for events sharing the same traceId or requestId: a
waterfall of correlated spans, overview facts, correlated activity grouped by
category, and the raw JSON. Request spans break down into per-stage sub-bars
— onRequest hooks, parsing, context creation, beforeHandle hooks, the
handler, and send — so a request that "feels slow" shows where the time
went; a wide context bar on every request usually means sequential remote
lookups in the context factory (see
Context latency budgets).
Start there when debugging a route. The errors
view groups failures by owner — route, framework, provider, job, schedule,
outbox, client-side, devtools, or unknown — and each subsystem view shows
domain-specific metrics such as cache hits/misses, outbox attempts, or rate
limit decisions. The payments view focuses on checkout sessions, portal
sessions, refunds, verified webhooks, provider IDs, and failures. The
entitlements view focuses on paid product access decisions, subjects, denial
reasons, and check sources. The policies view focuses on observed
authorization decisions, abilities, denial reasons, and batch sources.
3. Optional local persistence
The default buffer is in memory. Enable local persistence when you want the timeline to survive dev server restarts:
import {
  createDevtoolsProvider,
  createFileDevtoolsStore,
} from "@beignet/devtools";

createDevtoolsProvider({
  store: createFileDevtoolsStore({
    filePath: ".beignet/devtools/core/events.jsonl",
  }),
});
You can also enable the built-in file store with environment variables:
DEVTOOLS_PERSIST=true
DEVTOOLS_PERSIST_PATH=.beignet/devtools/core/events.jsonl
The file store writes JSONL and compacts to the most recent configured events.
POST /api/devtools/clear clears the in-memory buffer and the configured store.
4. Configure watchers
Watchers own capture for each subsystem. Configure them through
createDevtoolsProvider(...):
createDevtoolsProvider({
  watchers: {
    requests: true,
    errors: true,
    useCases: true,
    eventBus: false,
    jobs: false,
    outbox: true,
    schedules: true,
    providers: true,
    db: true,
    cache: true,
    payments: true,
    entitlements: true,
    custom: true,
  },
});
Disabled watchers do not store matching events. The built-in watchers are
requests, errors, useCases, eventBus, jobs, outbox, schedules, providers, db,
cache, storage, uploads, mail, payments, flags, entitlements, notifications, auth, audit, policies, rateLimit, and
custom.
Custom integrations can register watcher metadata too. Custom watcher views
appear in the dashboard sidebar when they own custom events:
createDevtoolsProvider({
  watchers: {
    search: {
      label: "Search",
      description: "Search query and indexing diagnostics.",
      eventTypes: ["custom"],
    },
  },
});
Then record events with watcher: "search" so that custom watcher controls
whether they are stored.
5. Use cases are instrumented automatically
createUseCase(...) instruments every run by default. No devtools-specific
wiring is needed:
import { createUseCase } from "@beignet/core/application";

export const useCase = createUseCase<AppContext>();
Each run resolves the instrumentation port from ctx.ports, reads
ctx.requestId and trace context fields, and records usecase events that
share one nested span across start, end, and error phases. Failed runs
also record correlated error events. Without an installed sink, runs stay
silent. Pass instrumentation: false to opt out.
Provider instrumentation
Providers record external work through createProviderInstrumentation() from
@beignet/core/providers instead of depending on devtools directly;
@beignet/devtools implements the instrumentation port that helper resolves.
When provider instrumentation records an event during an active request,
devtools fills in the active requestId, traceId, and traceparent so
provider work stays correlated with the route, hook, and use-case timeline.
See Writing a provider for the instrumentation
conventions, resolution order, and watcher guidance.
Audit activity
Durable audit logs should still be written through your app's AuditLogPort.
Use createInstrumentedAuditLog() from @beignet/core/ports when local
debugging should also show sanitized audit activity:
import { createInstrumentedAuditLog } from "@beignet/core/ports";

const audit = createInstrumentedAuditLog({
  audit: durableAudit,
  instrumentation: ports,
});
The wrapper records the durable audit entry first, then emits a custom event
owned by the audit watcher into the resolved instrumentation port. Devtools
remains a local diagnostic view; it is not the durable audit store.
When an audit port is transaction-scoped, emit the devtools mirror only after the transaction commits. Keeping the transaction-scoped audit port durable-only is preferable to showing a local audit event for work that later rolls back.
Manual events
Use record() when application code wants to add a custom event. It fills id and timestamp for you.
ctx.ports.devtools.record({
  type: "custom",
  watcher: "search",
  name: "search.query",
  label: "Search query",
  summary: "24 results in 18ms",
  details: {
    query,
    resultCount: 24,
    durationMs: 18,
  },
});
Use log() only when you already have a complete DevtoolsEvent.
Redaction
Devtools uses the shared redaction helpers from @beignet/core/ports before events are stored. Sensitive keys such as authorization, cookie, set-cookie, x-api-key, token, password, secret, and credentials are replaced with [redacted].
Server request instrumentation records request headers for debugging, but it does not record request or response bodies by default. The request lifecycle view marks stored events when sensitive fields were redacted and warns if secret-shaped metadata keys remain visible.
Add an app-owned redactor through the server instrumentation option:
const server = await createNextServer({
  // ...
  instrumentation: {
    redact: (event) => ({
      ...event,
      details: scrub(event.details),
    }),
  },
});
Event types
| Type | Description | Key fields |
|---|---|---|
request | HTTP request handling | method, path, status, durationMs, stages, responseOwner |
error | Errors | message, stack, contractName, useCaseName, owner |
usecase | Use case execution | name, kind, phase, durationMs |
eventBus | Domain event publishing | eventName |
job | Background job lifecycle | jobName, status |
schedule | Schedule execution | scheduleName, status, cron, timezone |
provider | Provider lifecycle | providerName, action |
custom | App-specific diagnostics | name, label, summary, details |
All events share id, timestamp, an optional requestId, optional
traceId, optional spanId, optional parentSpanId, optional traceparent,
and an optional watcher for custom watcher ownership.
Endpoints
| Endpoint | Description |
|---|---|
GET /api/devtools | Dashboard UI |
GET /api/devtools/core/events | JSON event list |
GET /api/devtools/stream | Server-Sent Events stream |
POST /api/devtools/clear | Clear the in-memory buffer and configured store |
The events endpoint accepts type, requestId, traceId, and limit query
parameters.
Configuration
The provider controls whether events are recorded. The HTTP route controls whether those events are exposed. Both default to development-only behavior.
DEVTOOLS_ENABLED=true
DEVTOOLS_ENABLED=false
DEVTOOLS_MAX_EVENTS=1000
DEVTOOLS_PERSIST=true
DEVTOOLS_PERSIST_PATH=.beignet/devtools/core/events.jsonl
The default in-memory buffer keeps the latest 500 events. The events endpoint returns the latest 200 unless a limit query parameter is provided. Persistence is opt-in and uses .beignet/devtools/core/events.jsonl by default when enabled without a custom path.
Route handlers return 404 when NODE_ENV === "production" unless explicitly
enabled with application-owned authorization. Generated apps wire
DEVTOOLS_ENABLED through lib/env.ts: the devtools route is development-only
by default and can be disabled with DEVTOOLS_ENABLED=false. In production,
DEVTOOLS_ENABLED=true must be paired with authorize; otherwise the HTTP
route remains hidden. The starter's sidebar reads the same value for local
navigation, but production exposure is still controlled by the route.
For staging or internal production diagnostics, add application-owned authorization:
import { createDevtoolsRoute } from "@beignet/devtools";
import { getServer } from "@/server";

export const { GET, POST } = createDevtoolsRoute(
  async () => (await getServer()).ports.devtools,
  {
    basePath: "/api/devtools",
    enabled: process.env.DEVTOOLS_ENABLED === "true",
    authorize: (req: Request) =>
      req.headers.get("x-devtools-token") === process.env.DEVTOOLS_TOKEN,
  },
);
If authorize returns false, devtools responds with 404. If it returns a
Response, that response is used.